
Postdoctoral scholars are an important part of the research workforce. As experienced scientists, many postdocs enter a lab and are highly productive after only a short amount of time. However, many groups feel that postdocs are underpaid, relative to their experience and importance to the research enterprise.
A recent proposed federal rule change has the potential to dramatically increase postdoc pay. Currently, federal regulations indicate that salaried workers making less than $23,660 per year are eligible to receive overtime pay. The salary level was set several decades ago and has not risen despite significant cost-of-living increases and inflation. In March, President Obama directed the Department of Labor to update this regulation and raise the threshold such that salaried employees making less than $50,440 per year would be eligible to receive overtime pay.
Whispers around Washington suggest the Obama administration will announce the final version of the rule in the early summer. This concerns universities and other organizations that employ postdocs as most postdocs are salaried and make less than the proposed new threshold. The administration could write an exception to the rule that would exempt postdocs, but if that doesn’t happen, universities and those running labs would have two options: (1) institute a method to track postdoc overtime hours and compensate them appropriately or (2) increase postdoc pay above the new threshold. Most postdocs work more than 40 hours per week so whichever path an institution takes to addressing the new rule postdocs will almost certainly be paid more. But what effect will this have on postdoc employment?
For some insight, I looked at how the postdoc population responded to previous pay increases. For these analyses, I used the NIH-mandated NRSA minimum pay as many universities pay their American postdocs according to this scale. Also, I focused on only year 0, or starting, postdoc salaries. This group is almost certainly the largest fraction of the postdoc population, and the decision on whether to hire someone as a postdoc is typically made for new Ph.D.s rather than a postdoc with several years’ experience.
I looked at year 0 postdoc pay from 1998 to 2013 compared to the overall postdoc population (Fig. 1). Postdoc pay increased from 1997 to 2013, and the largest year-to-year increases were in 1999 (25 percent increase over 1998), 2002 (10 percent) and 2003 (10 percent). Postdoc salary increased between 0 and 5 percent in the other years. During this time frame, the postdoc population generally grew from 1997 to 2010 before beginning to decline. The 25 percent increase in postdoc pay in 1999 resulted in no growth in the total population. But all other years showed growth in the postdoc population until 2010 despite 10 percent increases in pay in 2002 and 2003. Postdoc pay and population show a positive correlation (Pearson’s r = 0.88).
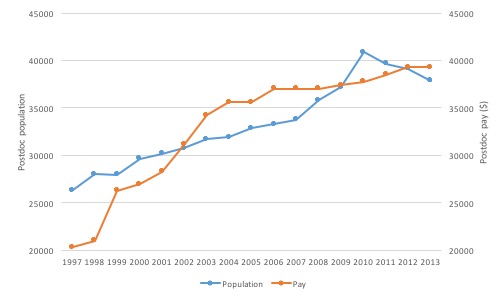
Figure 1: The biomedical postdoc population, as reported in the NSF Survey of Graduate Student and Postdoctorates in Science and Engineering, and the NIH NRSA minimum pay for year 0 postdocs in the indicated year.
(Note: Dollar values are not corrected for inflation. These analyses are concerned with how the stated level of postdoc pay at that specific time affected overall postdoc population, and not with comparisons of purchasing power across multiple years.)
These data indicate that the increased cost of postdoc pay was not sufficiently high to limit expansion of this population. This suggests universities and PIs were able to accommodate consistently increasing postdoc salaries as well as hiring more postdocs at these higher rates. Three models could explain these data: (1) PIs rearranged their finances, either receiving more grant money or shifting priorities within their grant, increasing postdoc pay and cutting other grant-funded activities, (2) the enterprise began to rely on international postdocs, who are not necessarily always paid the NRSA minimum or (3) there was sufficient financial slack in the system to accommodate increasing postdoc pay and population.
For model 1, grant applications did increase from 1997 through 2007, although this is likely due to increased funding at the NIH due to the budget doubling and resulting stagnation rather than pressure to pay postdocs more money (NIH Data Book). There are not clear methods to discern whether PIs cut research activities to pay their postdocs.
Model 2 focuses on the ratio of American to international postdocs in the research enterprise. International postdocs are not always paid at the same levels as American postdocs, and this practice varies on an institution-by-institution, and sometimes a lab-by-lab, basis. I next analyzed how the international and domestic postdoc populations responded to increases in the NRSA minimum (Fig. 2). The 25 percent increase in postdoc pay in 1999 coincided with a decrease in the American postdoc population. The American postdoc population was then mostly flat until 2005 when it began to increase. The international population increased from 1999 to 2003 and then leveled off. Both populations began to rise again several years later. These data indicate that the American postdoc population was flat during the periods of the largest pay increases while the international postdoc population steadily increased. These data, of course, do not provide causative information on the differences in population growth, but the coincidence is striking.
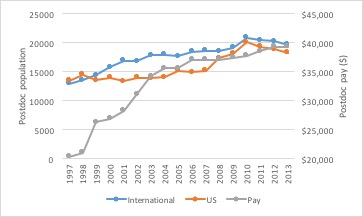
Figure 2: The biomedical international and U.S. postdoc populations, as reported in the NSF Survey of Graduate Student and Postdoctorates in Science and Engineering, and the NIH NRSA minimum pay for year 0 postdocs in the indicated year.
Only domestic postdocs are eligible for support from training grants and fellowships. One possible explanation for the stagnant domestic postdoc population is that the number of training grant and fellowship slots was reduced from 1999 to 2005. Indeed, the number of postdocs funded by training grant slots dipped in 1999, the year of the 25 percent increase in pay (Fig. 3A). However, these slots immediately recovered the following year. Fellowship slots were in a consistent decline across the entire time frame shown here. When combined, the largest postdoc pay increases (1999, 2002, 2003) had little effect on the number of training mechanism slots (TG+F) available (Fig. 3B).
A
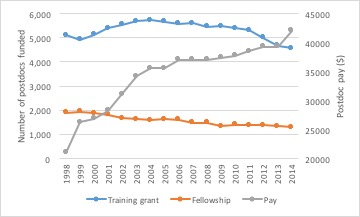
B
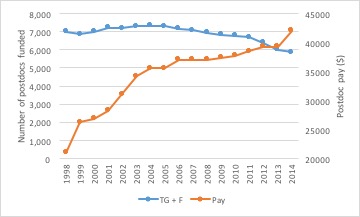
Figure 3: The number of postdocs funded by training grants or fellowships (A) individually or combined (B), as reported in the NIH Data Book, and the NIH NRSA minimum pay for year 0 postdocs in the indicated year.
Model 3 suggests the research enterprise had sufficient funds to accommodate increasing postdoc pay and population. The overwhelming majority of postdocs are funded on research project grants, primarily R01s, rather than training grants or fellowships (NIH Data Book). Similar to postdoc pay, the average size of RPGs and R01s almost always increased on a year-to-year basis (current dollars: RPG and R01-equivalents).
To analyze the relationship between postdoc pay and the funding mechanism, I compared the ratio of year 0 postdoc pay to the average RPG and R01-equivalent size since 1998. Postdoc pay increased by 25 percent in 1999, and the ratio of postdoc pay to the average RPG and R01-equivalent increased by about 1.5 percent (Fig. 4). After this, the ratio remained remarkably consistent: a year 0 postdoc’s pay accounts for 8.2-9.2 percent of an average RPG or 9.3-10.2 percent of an average R01 equivalent. These data indicate that the 25 percent pay increase in 1999 significantly shifted how much of a grant is absorbed by a postdoc’s salary. However, in other times of significant pay increases for postdocs (e.g., 2002, 2003), the size of RPGs and R01 equivalents grew to an extent that the increase in postdoc pay did not account for a significantly larger fraction of the grant.
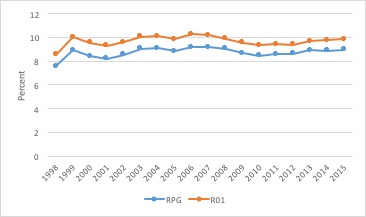
Figure 4: The NIH NRSA minimum pay for year 0 postdocs as a percentage of the average research project grant or R01-equivalent for the indicated year. Data found in the NIH Data Book.
So what does this all mean relative to the overtime rule change proposed by the Obama administration? First, these conclusions are dependent on the administration thinking that postdocs should be eligible to be paid overtime. Should postdocs be eligible, an increase for the minimum postdoc pay to $50,440 from the 2016 level of $43,692 would be a 14 percent increase in postdoc pay – the largest increase since 1999. This increase would undoubtedly cause universities and labs to rethink how they pay postdocs. However, part of the answer may already be included in the standard mechanisms of funding. Between 1999 and 2015, the average increase in the average R01-equivalent size is roughly $11,000, nearly twice the amount needed to cover the pay increase for a single postdoc (Fig. 5). So part of the cost of this higher pay may be covered by the NIH’s standard increase in R01 size.
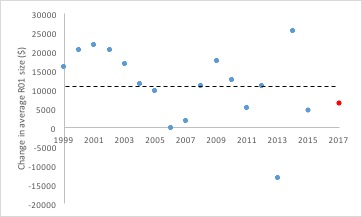
Figure 5: The year-to-year change in the average R01-equivalent size. The red data point indicates the increase needed to cover a single year 0 postdoc pay at $50,440. The dashed line indicates the average increase in average R01-equivalent size from 1999 to 2015. Note, there is no data point for 2016 as the average R01-equivalent size is not yet known.
Another dimension to consider is the ratio of domestic and international postdocs. The proposed rule change, from what I could find, does not specify that this would affect only American workers. Thus, labs and institutions that pay international postdocs less than domestic ones may find it more financially difficult to properly compensate international postdocs. This could prompt a shift toward more domestic postdocs than foreign ones.
Ultimately, we will need to wait to see how the final overtime rule treats domestic and international postdocs, and how federal agencies and universities respond to know what the effects will be on the postdoc population. However, evidence from the past 15+ years indicates that dramatic postdoc pay increases do not necessarily translate into postdoc job losses.